4 Measurement Process
Overview of the 16S rRNA marker gene metagenomics measurement process including the sources of error and bias introduced at different step in the process along with different mitigation strategies that have been developed to address each of the issues. See Goodrich et al. (2014) for a review of 16S rRNA marker gene metagenomics measurement process and general recomendations for conducting a microbiome study.
J. Zhou et al. (2011) Used biological and technical replicates with a Shewanella oneidenis MR-1 to assess the reproducibility and quanitative accuracy of 16S sequencing, using 454 pyroseuqencing and targeting the V45 region. Results demonstrated a lack of reporducibility and quantiative accuracy when comparing the \(\beta\) diversity and relative abundance between replicates.
Diagram of measurement process 4.1.
## Package 'qcc', version 2.6## Type 'citation("qcc")' for citing this R package in publications.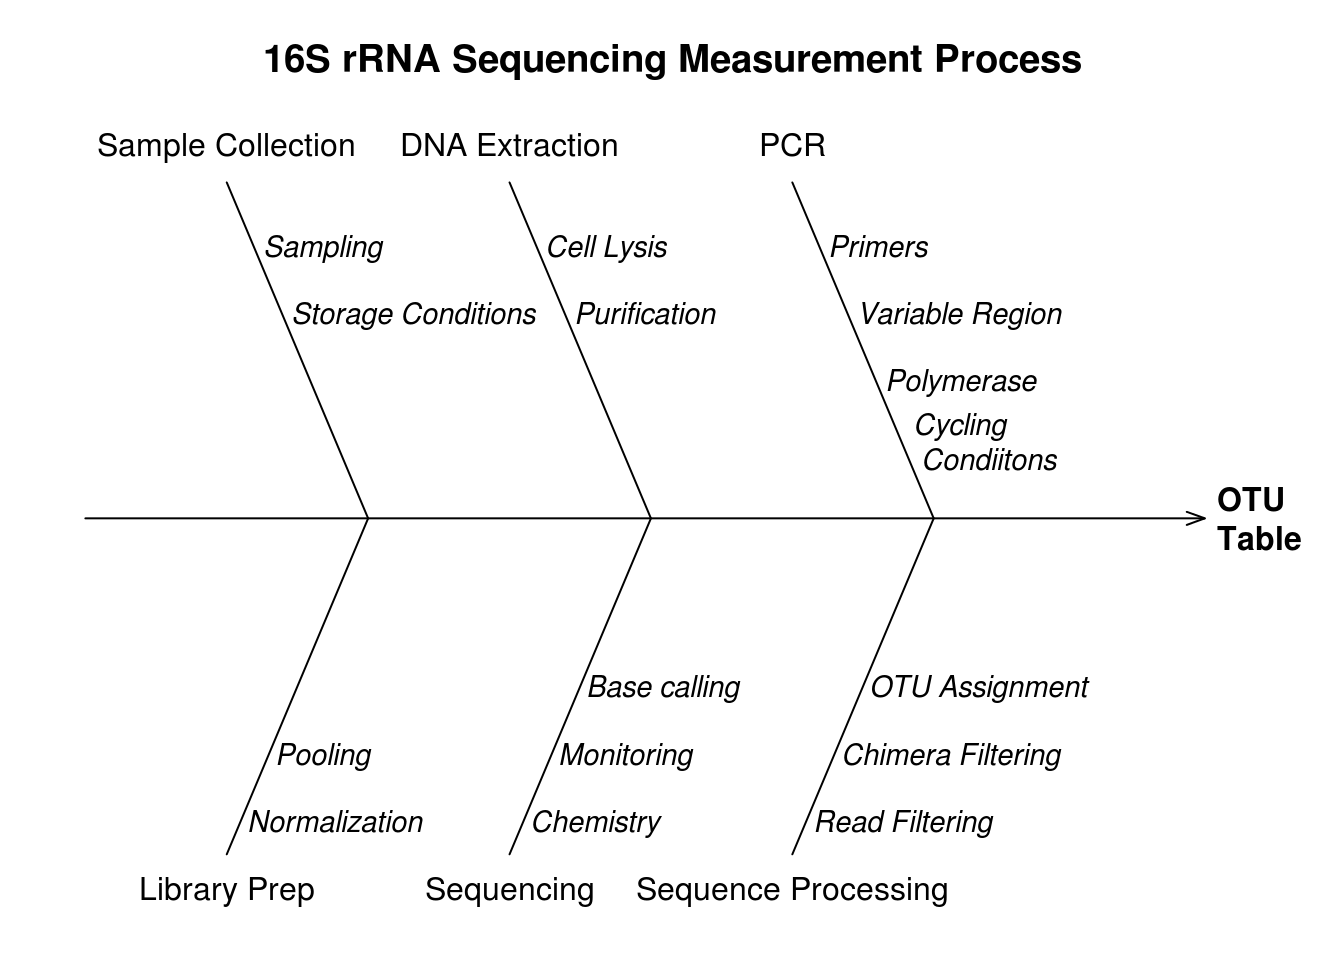
Figure 4.1: Fishbone diagram of the 16S rRNA metagenomic sequencing measurement process.
Review of what is currently known about the sources of error and bias in the 16S metagenomics measurement process. Cause-effect diagrams are commonly used in process quality control to show the relationship between steps in the measurement process and sources of error or bias 4.2.
Potentially may want to revise to focus on sources of error, e.g. cell type bias, preferential amplification, sequence errors, chimeras .
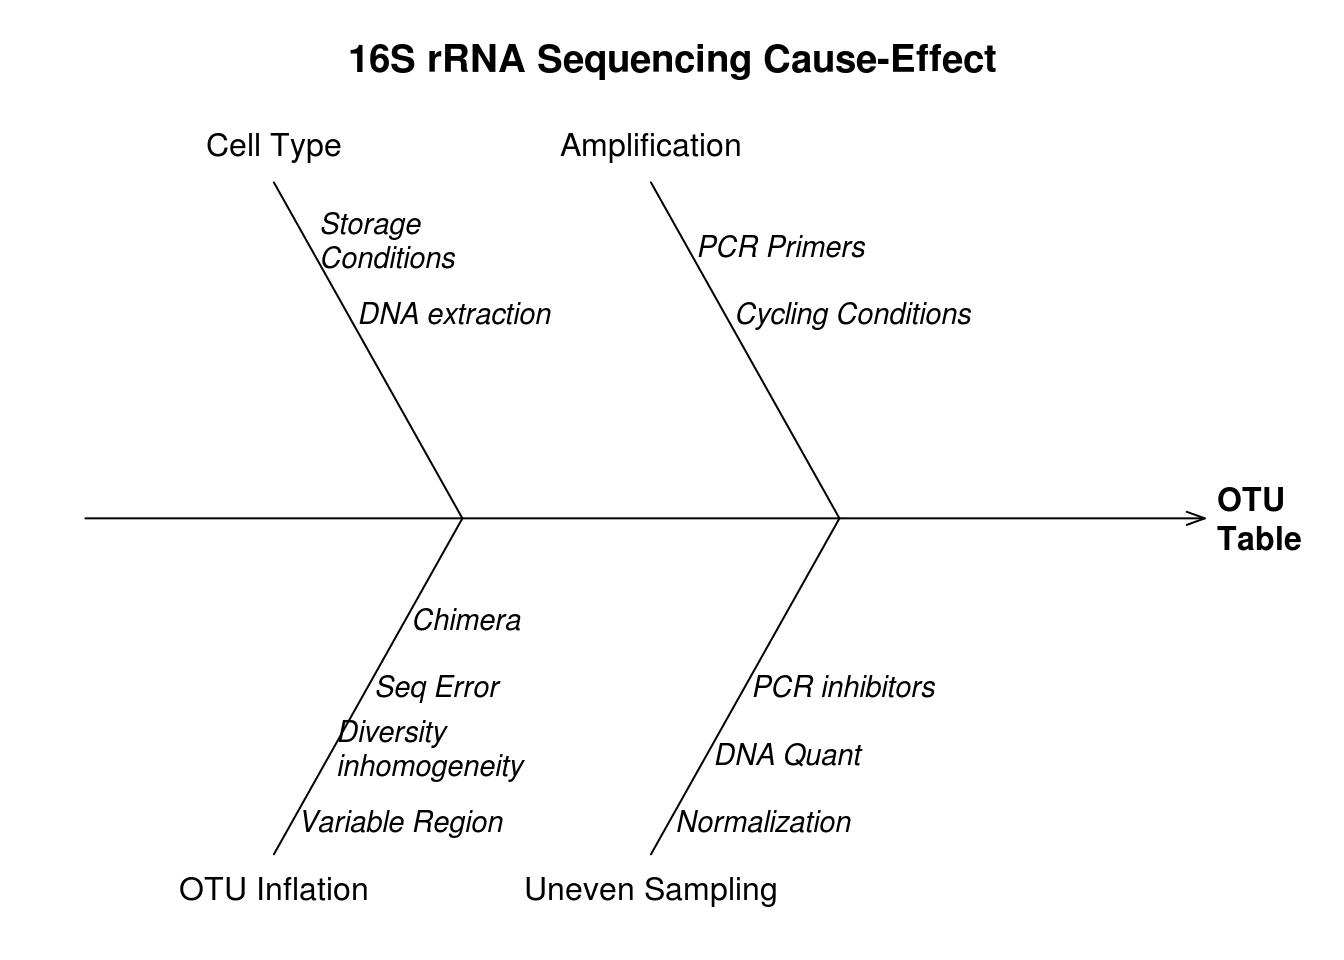
Figure 4.2: Causes (branch labels) of bias and variability indicated for different sources of error (branch text).
4.1 Sample to Seq
The first part of the measurement process is generating sequencing data from an environmental sample.
The part consists of five main steps:
- Sample Collection
- Sample Processing
- 16S rRNA PCR
- Library Prep
- Sequencing
4.1.1 Sample Collection
- Collection of sample that is representative of population being studied
- Kitty Biome study as an example of sample heterogeneity
- Kitty Biome study as an example of sample heterogeneity
- Impact of sample storage
- Flores et al. (2015) evaluated impact of storage conditions on 16S metagenomics. The study results supported the use of RNALater as storage media after evaluating the different temperature, media, and duration for biological replicate stool samples. The results were evaluated using intraclass correlation coefficients as well as \(\alpha\) and \(\beta\) diversity. DATA NOT PUBLICALLY AVAILABLE!!!!!
- Old coral study?
- Hill et al. (2016) evlauated the use of DNA Genotek storage vial on microbiomes for infant and elderly samples. Found OTU specific differential abundance results. Elderly samples were less impacted by storage than infant samples. Results suggest that the impact of storage conditions is organism specific.
- Lauber et al. (2011) study evaluating the impact of storage conditions, weighted UniFrac community analysis not impacted by storage conditions, whereaas for skin communities storage conditions impacted unweighted UniFrac results.
- G. D. Wu et al. (2010) another study evaluating the impact of storage conditions
- Sinha et al. (2016) compared impact of storage and sample collection methods for fecal microbiome studies as part of an interlaboratory study. Found storage methods produced similar results to samples immediately processed. Differences in results between laboratories are likely due to differences in sample processing methods (e.g. DNA extraction method, PCR primers, target region) than a laboratory effect.
- Flores et al. (2015) evaluated impact of storage conditions on 16S metagenomics. The study results supported the use of RNALater as storage media after evaluating the different temperature, media, and duration for biological replicate stool samples. The results were evaluated using intraclass correlation coefficients as well as \(\alpha\) and \(\beta\) diversity. DATA NOT PUBLICALLY AVAILABLE!!!!!
4.1.2 Sample Processing
4.1.2.1 DNA extraction
Considerations:
- Cell type specific extraction biases
- DNA concentration requirements for library prep
- Issues with low concentration samples - skin microbiome
- Issues with low concentration samples - skin microbiome
- Extra cellular DNA
- Nucleic acids exuded from cells
- Relic DNA, DNA from dead cells.
- Carini et al. (2016) used Propidium monoazide (PMA) to evaluate the impact of DNA from dead cells on 16S and ITS metagenomic diversity estimates. For both the fungal and microbial communities 40% of the DNA was from dead cells as a result a significant proportion of the oberved microbial diversity was from dead cells.
- Need to take the presence of relic DNA into consideration when interpreting metagenomic results, not just characterizing the active, viable, or living cells at point of sampling, but also system history.
- Sequencing rRNA instead of rDNA is also used to characterize the active component of the microbial community (Blazewicz et al. 2013). Though this method it’s own limiations.
- See Cangelosi and Meschke (2014) for other methods for targeting viable microbial community.
- Carini et al. (2016) used Propidium monoazide (PMA) to evaluate the impact of DNA from dead cells on 16S and ITS metagenomic diversity estimates. For both the fungal and microbial communities 40% of the DNA was from dead cells as a result a significant proportion of the oberved microbial diversity was from dead cells.
- Nucleic acids exuded from cells
- PCR inhibitiors
- Old PCR inhibitor paper.
- Any studies showing inhibitors inducing biases in metagenomic studies?
- Potentially sample specific biases but do not know of any within sample biases
- Old PCR inhibitor paper.
- Cell type extraction biases
- Albertsen et al. (2015) evalauted the impact of different DNA extraction methods for activated slude communities. Bead beating both time and intensity impacted the yield and size distribution of the extracted DNA as well as the observed abundance of different bacteria at both the phylum level and class for Proteobacteria.
- Extraction methods vary in there ability to extract DNA from hard to lyse cells (Olson and Morrow 2012), e.g. Gram positives, and reproducibiliy of the results (Carrigg et al. 2007) (Ettenauer et al. 2012).
- No known method to correct for or quantify extraction biases.
- Whole cells control materials may provide a way to correct for cell type specific extraction biases.
- Limitation to comparing results from multiple studies when different extraction methods were used.
- Albertsen et al. (2015) evalauted the impact of different DNA extraction methods for activated slude communities. Bead beating both time and intensity impacted the yield and size distribution of the extracted DNA as well as the observed abundance of different bacteria at both the phylum level and class for Proteobacteria.
4.1.3 16S rRNA PCR
4.1.3.1 Template concentration
- This is related to low concentration samples or samples with poor DNA extraction efficiencies.
Kennedy et al. (2014) showed that the profile of replicate samples for different template concentration was more variable then when the imput concentration is the same. Pooling replicate PCR reactions decreased the within sample variablility.
D’Amore et al. (2016) increasing the template concentration from 1 ng to 10 ng for MiSeq lead to higher percentages of chimeric reads 0.08 compared to 0.2% (p = 0.20).
4.1.3.2 Target variable region
Clooney et al. (2016) Compared sequencing data between platforms and variable regions. Based on the relative abundance of genera present in 20% of the datasets (including whole metagenome sequencing (WMS)) the V12 and V45 primer regions, PGM sequencing data was less impacted than MiSeq to different variable regions.
Kozich et al. (2013) compared the results for three different variable regions sequenced using the MiSeq platform. The three regions, V34, V4, and V45 represented different length (250 bp, 430 bp, and 375 bp) though overlapping target regions. The observed error rate varied between run as well as variable regions resulting in differences in predicted OTUs. V45 had the highest predicted OTUs for all samples and replicate sequencing runs, followed by V34 and V4. The number of observed OTUs was higher for all datasets than expected for the mock community datasets.
4.1.3.3 PCR primers (optional barcoded primers)
Albertsen et al. (2015) performed both an in silico and in vitro comparison of primer regions as well as comparing the relative abundance of different Phyla to metagenomic and metatranscriptomic datasets. The author’s concluded by recomending V13 for activated sludge samples based on what is known about the community composition of the system.
Esling, Lejzerowicz, and Pawlowski (2015) developed a latin square barcode design to facilitate detection and removal of cross-contamination along with tools for implenting their recomended barcoding methods, https://github.com/esling/mistagging.
D’Amore et al. (2016) evaluated the impact of primer mismatches using a mock community dataset by correlating abundance with mismatches.
Engelbrektson et al. (2010) explored the impact of different primers, variable regions, and amplicon legnths on $diversity metrics for termine gut samples. Amplicon lengths impacted diversity and richness estimates but primers targeting the same region had consistent results.
4.1.3.4 PCR reagents
- Error rates vary based on the polymerase being used, it is commonly recommended that a high fidelity polymerase is used.
- DNA polymerase from organisms can remain in extracted DNA after purification and potentially amplify the organisms DNA and potentially risk skewing experiments when comparing microbiomes from different environments (Marx 2016). This has not been tested therefore the impact is unknown.
- Can calcualte the errors due to PCR using first principles (Marx 2016)
- Polymerase - high fidelity
- Reagent contaminats
4.1.3.5 PCR cycling conditions
4.1.3.6 number of cycles
Using a mock community of 68 organisms D’Amore et al. (2016) showed that increasing the number of PCR cycles resulted in increased sequencing error rates (0.58% vs. 0.64% p = 0.11) and chimeras (15 cycles 0.00% and 25 cycles 0.66%, p = 0.0245).
Albertsen et al. (2015) evaluated the amount of template and cycle number but only observed “small changes”. Decreasing the annealing temperatures of 58C and 52C resulted in increased abundance of prevously low abundance OTU with no impact on high abundance OTUs.
Yu et al. (2015) compared standard and nest PCR (barcodes used in the second round), showed that the number of cycles and use of separate PCR and indexing reactions influenced the number of observed OTUs and \(\beta\) diversity.
4.1.3.7 Sequence Copy Abundance
4.1.3.8 Chimeras
4.1.4 Library Preparation
Kennedy et al. (2014) found that variability due to PCR (particularly template concentration) resulted in less variability for within sample results than sample preparation (library preparation) and inter-lane variability. Barcoded 16S PCR primers were used in the study therefore the impact of barcodes and variability of 16S PCR was confounded.
Schirmer et al. (2015) sequenced a mock community of 59 different strains to evaluate the sequencing error rate for different sample processing methods. Though only fully characterizing a subset of a the results.
4.1.4.1 Barcode/ indexing (optional)
- Do not know of any barcode specific biases
4.1.4.2 Normalization and Pooling
- Methods
- DNA quantification
- Bead based assays
- DNA quantification
- Associated Biases
- Uneven sequencing depth - impact of coverage
4.1.5 Sequencing
- Sequencing platforms
- Illumina - MiSeq, HiSeq, GAII
- Ion Torrent
- PacBio
- Oxford Nanopore - Minion
- Factors impacting measurement results
- Read length
- Sequencing chemistry
- Read length
- Studies comparing platforms
- Clooney et al. (2016) compared 16S rRNA sequence data for environmental samples sequenced using two platforms MiSeq and PGM. Comparing results between stool samples from six individuals based on the relative abundance of genera present in 20% of the datasets (including whole metagenome sequencing (WMS)) the datasets clustered together based on sequencing methods (platform and primers) rather than individual, with WMS clustering seperately form the 16S results (Clooney et al. 2016, fig. 1).
- Sequencing errors
- Random errors - general error rates
- Systematic sequencing errors
- How systematic and random errors impact diversity studies.
- Random errors - general error rates
4.2 Seq to OTU
Convering raw sequence data to a OTU table with taxonomic annotations for use in downstream applications.
4.2.1 Preprocessing
- Filtering and Trimming
- Filtering low quality reads - short reads with high error rates.
- Trimming reads - removing ends of reads based on base quality score as well as removal of adapter sequences that were added during sample processing.
- Approaches
- Quality Score
- min quality score
- Illumina QS2
- Illumina QS2
- Window average
- min quality score
- Length
- Min length
- Min length
- Trimming left and right ends
- Barcode and primer based
- Quality Score
- Tools
- Trimmomatic
- Sickle
- fastx
- Trimmomatic
- Filtering low quality reads - short reads with high error rates.
- Error correction
- BayesHammer
- DADA2
- Deblur?
- BayesHammer
- Merging paired ends
- Merging forward and reverse reads into single contigs
- Methods
- Perfect overlap - DADA2
- dynamic programming - mothur
- Probabilistic/ Optimization
- FLASH
- PANDAseq Masella et al. (2012)
- Uses a probabilitistic approach to generating contigs from paired-end reads
- First finds primers in forward and reverse sequences (optional)
- Determines overlap by maximizing the Probablity of the contig for overlap length greater than the user defined value.
- Bases in Non-overlaping regions assigned probability of 1/4
- Bases in overlaping regions assigned a probability based on the assigned base quality score and whether the bases agree between the forward and reverse reads.
_ Additional algorithms available; ea utils fastqJoin, FLASH, PEAR, RDP, STICH, and UPARSE
- Bases in Non-overlaping regions assigned probability of 1/4
- Assigns base and quality score for overlap regions
- for disagreements assigns base for higher quality score and assigns probability using a probabilistic method using the fastq quality scores
- Calculate contig average error - geometric mean [\(\left(\prod^n_{i=1}x_i\right)^{1/n}\)]of the assigned quality scores
- First finds primers in forward and reverse sequences (optional)
- Calculates the probability of an observed base using the assigned quality scores
- conditional probability that the true nucleotides for the aligned paired end reads given the observed nucleotides
- Assumes equal probablity for alternative (non-observed bases)
- Option to use primer sequences location and removal during overlap generation
- conditional probability that the true nucleotides for the aligned paired end reads given the observed nucleotides
- Filter/ validating contigs
- average contig quality score (removed in v2.8 due to bug)
- contig length
- ambiguous bases
- optional - known secondary structure, conserved regions, not implemented in distribution
- statistical methods - pear false positive test
- Method evaluation
- Simulated data - test algorithm correctness
- single template amplicon PCR - check contig quality
- defined fragment mixture to check assembly yields
- Simulated data - test algorithm correctness
- Uses a probabilitistic approach to generating contigs from paired-end reads
- PEAR
- Algorithm Summary
- Optimizes assembly score for based on base quality score and mismatches
- See J. Zhang et al. (2014) for alignment base probability calculations
- Developed Observed Expected alignment score (OES) for use in testing significance of merge
- Method Evaluation
- simulated data comparison of multiple paired-end assembly methods for multiple fragment sizes and overlap
- Compared based on the number of merged contigs and false positive rate, also assessed computational cost
- Also evaluated using single organism datasets
- Algorithm Summary
- FLASH
- Methods
- chimera detection
- detection and removal of chimeric reads, artifact of the PCR amplification process.
- ChimeraSlayer
- uchime
- DADA2 - bimera
- ChimeraSlayer
4.2.2 OTU Assignment
OTU assignment most commonly by clustering is used to reduce the number of spurious observations, sequences are grouped into OTUs.
- Different approaches to clustering
- distance based clustering - most commonly used
- Distance based clustering is a NP hard problem (i.e. computationaly intense), therefore a number of heuristics are used to make the method computationally tractable for large datasets.
- Threshold are used to define the similarity of sequences within a cluster, 99% and 97% are commonly used.
- Some biological and sequencing error basis for threshold values, (e.g. 99% species level, 97% genus level, 1% error rate). Taxonomic variability in 16S rRNA sequence diversity (Pai?) and sequencing error (Huse et al. 2010, Schirmer et al. (2015), D’Amore et al. (2016)) challenges the validity of these values.
- Different distance based thresholds.
- average linkage
- single linkage
- complete linkage
- average linkage
- Other clustering/ OTU assignment methods include:
- distribution based
- oligotyping
- tree based clustering (D. Wu, Doroud, and Eisen 2013)
- distribution based
- De novo vs Reference based clustering
- Sequences can be clustered with a set of reference cluster centers or without (de novo).
- distance based clustering - most commonly used
4.2.3 Taxonomic Assignment
Assign clusters a taxonomic name * (“Comparison of two next-generation sequencing technologies for resolving highly complex microbiota composition using tandem variable 16S rRNA gene regions.” 2010) in silico analysis of the taxonomic resolution for different variable regions and read lengths (454 and MISeq 150, 100, 75, and 50 bp paired end reads) and primers.
4.3 Downstream analysis
4.3.1 Differential Abundance
- Differences in taxa or OTU abundance between experimental factors, e.g. treatment vs. control.
- Similarity to RNA-seq/ microarray differential abundance
- Key factors
- Effect size, sample size, abundance
- Effect size, sample size, abundance
- See Jonsson et al. (2016) for summary of different methods
- Overview of different methods and approaches
- Statistical distributions
- DESeq2 and DESeq use a negative binomal along with shrinkage methods for estimates Love, Huber, and Anders (2014)
- use Bayesian method for shrinkage which is robust to outliers.
- DESeq2 and DESeq use a negative binomal along with shrinkage methods for estimates Love, Huber, and Anders (2014)
- Normalization methods
- Transformations
- DESeq2 using a regulaized logarithm transformation, similar to \(log2\) transformation but addresses issue with noise for low count values, method applies the same shrinkage approach to that used for estimating count dispersion and log fold change.
- Statistical distributions
- Key difference between methods is how the count distributions are modeled, specificially how the distribution parameters e.g. mean, standard deviation, and fold change (between conditions) are estimated from the observed data.
4.3.2 Alpha Diversity
- Measure of biological or ecological diversity within a sample.
- Alpha diversity as a continuum related to the metric dependence on richness and evenness (Chao et al. 2014)
- Four primary categories richness, evenness, abundance weighted, and dissimilarity (Ricotta 2007)
- Parametric vs. Non-parametric diversity metrics for 16S rRNA sequence analysis (Bunge, Willis, and Walsh 2014)
- Development of alpha diversity richness metric for microbial diversity.
- Chao1 a traditional diversity metric estimates total diversity using the number of singletons, OTUs representing only a single sequence.
- Issue with singleton based diversity metrics for microbial diversity is that for incresed sequencing depth the number of singletons with continue to increase due to sequencing errors, leading to artifically inflated diversity estimates.
- Chiu and Chao (2015) developed a modified version of the Chao1 estimator that is more robust to singletons bue to sequencing errors.
- This method estimates diversity based on the number of doubletons to tentons.
- Incorporates Hill numbers as well.
- Chao1 a traditional diversity metric estimates total diversity using the number of singletons, OTUs representing only a single sequence.
4.3.3 Beta Diversity
4.4 Step-by-Step protocols
- Albertsen et al. (2015) Activated Sludge http://www.midasfieldguide.org/
- List of tools for each step in the sequence analysis workflow http://h3abionet.org/tools-and-resources/sops/16s-rrna-diversity-analysis
References
Goodrich, Julia K., Sara C. Di Rienzi, Angela C. Poole, Omry Koren, William A. Walters, J. Gregory Caporaso, Rob Knight, and Ruth E. Ley. 2014. “Conducting a Microbiome Study.” Cell 158 (2). Elsevier Inc.: 250–62. doi:10.1016/j.cell.2014.06.037.
Zhou, Jizhong, Liyou Wu, Ye Deng, Xiaoyang Zhi, Yi-Huei Jiang, Qichao Tu, Jianping Xie, Joy D Van Nostrand, Zhili He, and Yunfeng Yang. 2011. “Reproducibility and quantitation of amplicon sequencing-based detection.” The ISME Journal 5 (8). Nature Publishing Group: 1303–13. doi:10.1038/ismej.2011.11.
Flores, Roberto, Jianxin Shi, Guoqin Yu, Bing Ma, Jacques Ravel, James J. Goedert, and Rashmi Sinha. 2015. “Collection media and delayed freezing effects on microbial composition of human stool.” Microbiome 3 (1). BioMed Central Ltd: 33. doi:10.1186/s40168-015-0092-7.
Hill, Cian J, Jillian R M Brown, Denise B Lynch, Ian B Jeffery, C Anthony Ryan, R Paul Ross, Catherine Stanton, and Paul W O’Toole. 2016. “Effect of room temperature transport vials on DNA quality and phylogenetic composition of faecal microbiota of elderly adults and infants.” Microbiome 4 (1). BioMed Central: 19. doi:10.1186/s40168-016-0164-3.
Lauber, Christian L, Nicholas Zhou, Jeffrey I Gordon, and Rob Knight. 2011. “Effect of storage conditions on the assessment of bacterial community sturture in soil nad human-associated samples.” FEMS Microbiology Letters 307 (1): 80–86. doi:10.1111/j.1574-6968.2010.01965.x.Effect.
Wu, Gary D, James D Lewis, Christian Hoffmann, Ying-Yu Chen, Rob Knight, Kyle Bittinger, Jennifer Hwang, et al. 2010. “Sampling and pyrosequencing methods for characterizing bacterial communities in the human gut using 16S sequence tags.” BMC Microbiology 10 (January): 206. doi:10.1186/1471-2180-10-206.
Sinha, Rashmi, Jun Chen, Amnon Amir, Emily Vogtmann, Jianxin Shi, Kristin S Inman, Roberto Flores, Joshua Sampson, Rob Knight, and Nicholas Chia. 2016. “Collecting Fecal Samples for Microbiome Analyses in Epidemiology Studies.” Cancer Epidemiology, Biomarkers & Prevention : A Publication of the American Association for Cancer Research, Cosponsored by the American Society of Preventive Oncology 25 (2): 407–16. doi:10.1158/1055-9965.EPI-15-0951.
Carini, Paul, Patrick J Marsden, Jonathan W Leff, Emily E Morgan, Michael S Strickland, and Noah Fierer. 2016. “Relic DNA is abundant in soil and obscures estimates of soil microbial diversity.” Cold Spring Harbor Labs Journals. doi:10.1101/043372.
Blazewicz, Steven J, Romain L Barnard, Rebecca A Daly, and Mary K Firestone. 2013. “Evaluating rRNA as an indicator of microbial activity in environmental communities: limitations and uses.” The ISME Journal 7 (11). International Society for Microbial Ecology: 2061–8. doi:10.1038/ismej.2013.102.
Cangelosi, Gerard A, and John S Meschke. 2014. “Dead or alive: molecular assessment of microbial viability.” Applied and Environmental Microbiology 80 (19): 5884–91. doi:10.1128/AEM.01763-14.
Albertsen, Mads, Søren M Karst, Anja S Ziegler, Rasmus H Kirkegaard, and Per H Nielsen. 2015. “Back to Basics - The Influence of DNA Extraction and Primer Choice on Phylogenetic Analysis of Activated Sludge Communities.” PloS One 10 (7). Public Library of Science: e0132783. doi:10.1371/journal.pone.0132783.
Olson, Nathan D, and Jayne B Morrow. 2012. “DNA extract characterization process for microbial detection methods development and validation.” BMC Research Notes 5 (1). BMC Research Notes: 668. doi:10.1186/1756-0500-5-668.
Carrigg, Cora, Olivia Rice, Siobhán Kavanagh, Gavin Collins, and Vincent O’Flaherty. 2007. “DNA extraction method affects microbial community profiles from soils and sediment.” Applied Microbiology and Biotechnology 77 (4): 955–64. doi:10.1007/s00253-007-1219-y.
Ettenauer, Jörg D, Guadalupe Piñar, Ksenija Lopandic, Bernhard Spangl, Günther Ellersdorfer, Christian Voitl, and Katja Sterflinger. 2012. “Microbes on building materials - Evaluation of DNA extraction protocols as common basis for molecular analysis.” The Science of the Total Environment 439C (October). Elsevier B.V.: 44–53. doi:10.1016/j.scitotenv.2012.09.005.
Kennedy, Katherine, Michael W. Hall, Michael D J Lynch, Gabriel Moreno-Hagelsieb, and Josh D. Neufeld. 2014. “Evaluating bias of Illumina-based bacterial 16S rRNA gene profiles.” Applied and Environmental Microbiology 80 (18): 5717–22. doi:10.1128/AEM.01451-14.
D’Amore, Rosalinda, Umer Zeeshan Ijaz, Melanie Schirmer, John G Kenny, Richard Gregory, Alistair C Darby, Christopher Quince, et al. 2016. “A comprehensive benchmarking study of protocols and sequencing platforms for 16S rRNA community profiling.” BMC Genomics 17. BMC Genomics: 1–40. doi:10.1186/s12864-015-2194-9.
Clooney, Adam G, Fiona Fouhy, Roy D Sleator, Aisling O’ Driscoll, Catherine Stanton, Paul D Cotter, and Marcus J Claesson. 2016. “Comparing Apples and Oranges?: Next Generation Sequencing and Its Impact on Microbiome Analysis.” PloS One 11 (2): e0148028. doi:10.1371/journal.pone.0148028.
Kozich, James J., Sarah L. Westcott, Nielson T. Baxter, Sarah K. Highlander, and Patrick D. Schloss. 2013. “Development of a Dual-Index Sequencing Strategy and Curation Pipeline for Analyzing Amplicon Sequence Data on the MiSeq Illumina Sequencing Platform.” Applied and Environmental Microbiology 79 (17): 5112–20. doi:10.1128/AEM.01043-13.
Esling, Philippe, Franck Lejzerowicz, and Jan Pawlowski. 2015. “Accurate multiplexing and filtering for high-throughput amplicon-sequencing.” Nucleic Acids Research 43 (10): 2513–24. doi:10.1093/nar/gkv107.
Engelbrektson, Anna, Victor Kunin, Kelly C Wrighton, Natasha Zvenigorodsky, Feng Chen, Howard Ochman, and Philip Hugenholtz. 2010. “Experimental factors affecting PCR-based estimates of microbial species richness and evenness.” The ISME Journal 4 (5). Nature Publishing Group: 642–7. doi:10.1038/ismej.2009.153.
Marx, Vivien. 2016. “PCR: the price of infidelity.” Nature Methods 13 (6). Nature Publishing Group, a division of Macmillan Publishers Limited. All Rights Reserved.: 475–9. doi:10.1038/nmeth.3868.
Yu, Guoqin, Doug Fadrosh, James J. Goedert, Jacques Ravel, and Alisa M. Goldstein. 2015. “Nested PCR Biases in Interpreting Microbial Community Structure in 16S rRNA Gene Sequence Datasets.” Plos One 10 (7): e0132253. doi:10.1371/journal.pone.0132253.
Schirmer, Melanie, Umer Z. Ijaz, Rosalinda D’Amore, Neil Hall, William T. Sloan, and Christopher Quince. 2015. “Insight into biases and sequencing errors for amplicon sequencing with the Illumina MiSeq platform.” Nucleic Acids Research 43 (6). doi:10.1093/nar/gku1341.
Masella, Andre P, Andrea K Bartram, Jakub M Truszkowski, Daniel G Brown, and Josh D Neufeld. 2012. “PANDAseq: Paired-End Assembler for Illumina Sequences.” BMC Bioinformatics 13 (1). BioMed Central Ltd: 31.
Zhang, Jiajie, Kassian Kobert, Tomáš Flouri, and Alexandros Stamatakis. 2014. “PEAR: A Fast and Accurate Illumina Paired-End ReAd MergeR.” Bioinformatics 30 (5). Oxford Univ Press: 614–20.
Huse, Susan M, David Mark Welch, Hilary G Morrison, and Mitchell L Sogin. 2010. “Ironing out the wrinkles in the rare biosphere through improved OTU clustering.” Environmental Microbiology 12 (7): 1889–98. doi:10.1111/j.1462-2920.2010.02193.x.
Wu, Dongying, Ladan Doroud, and Jonathan a. Eisen. 2013. “TreeOTU Operational Taxonomic Unit Classification Based on Phylogenetic Trees.” Arxiv.Org, 23. http://arxiv.org/abs/1308.6333.
“Comparison of two next-generation sequencing technologies for resolving highly complex microbiota composition using tandem variable 16S rRNA gene regions.” 2010. Nucleic Acids Research 38 (22). Department of Microbiology, University College Cork, Cork, Ireland. mclaesson@bioinfo.ucc.ie; Oxford University Press: e200. doi:10.1093/nar/gkq873.
Jonsson, Viktor, Tobias Österlund, Olle Nerman, and Erik Kristiansson. 2016. “Statistical evaluation of methods for identification of differentially abundant genes in comparative metagenomics.” BMC Genomics 17 (1). BioMed Central: 78. doi:10.1186/s12864-016-2386-y.
Love, Michael I, Wolfgang Huber, and Simon Anders. 2014. “Moderated Estimation of Fold Change and Dispersion for RNA-Seq Data with DESeq2.” Genome Biology 15 (12). BioMed Central: 1.
Chao, Anne, Nicholas J. Gotelli, T. C. Hsieh, Elizabeth L. Sander, K. H. Ma, Robert K. Colwell, and Aaron M. Ellison. 2014. “Rarefaction and extrapolation with Hill numbers: A framework for sampling and estimation in species diversity studies.” Ecological Monographs 84 (1): 45–67. doi:10.1890/13-0133.1.
Ricotta, Carlo. 2007. “A semantic taxonomy for diversity measures.” Acta Biotheoretica 55 (1): 23–33. doi:10.1007/s10441-007-9008-7.
Tuomisto, Hanna. 2012. “An updated consumer’s guide to evenness and related indices.” Oikos 121 (8): 1203–18. doi:10.1111/j.1600-0706.2011.19897.x.
Bunge, John, Amy Willis, and Fiona Walsh. 2014. “Estimating the Number of Species in Microbial Diversity Studies.” Annual Review of Statistics and Its Application 1 (1): 427–45. doi:10.1146/annurev-statistics-022513-115654.
Chiu, Chun-Huo, and Anne Chao. 2015. “Estimating and comparing microbial diversity in the presence of sequencing errors.” PeerJ, 1–13. doi:10.7287/peerj.preprints.11.